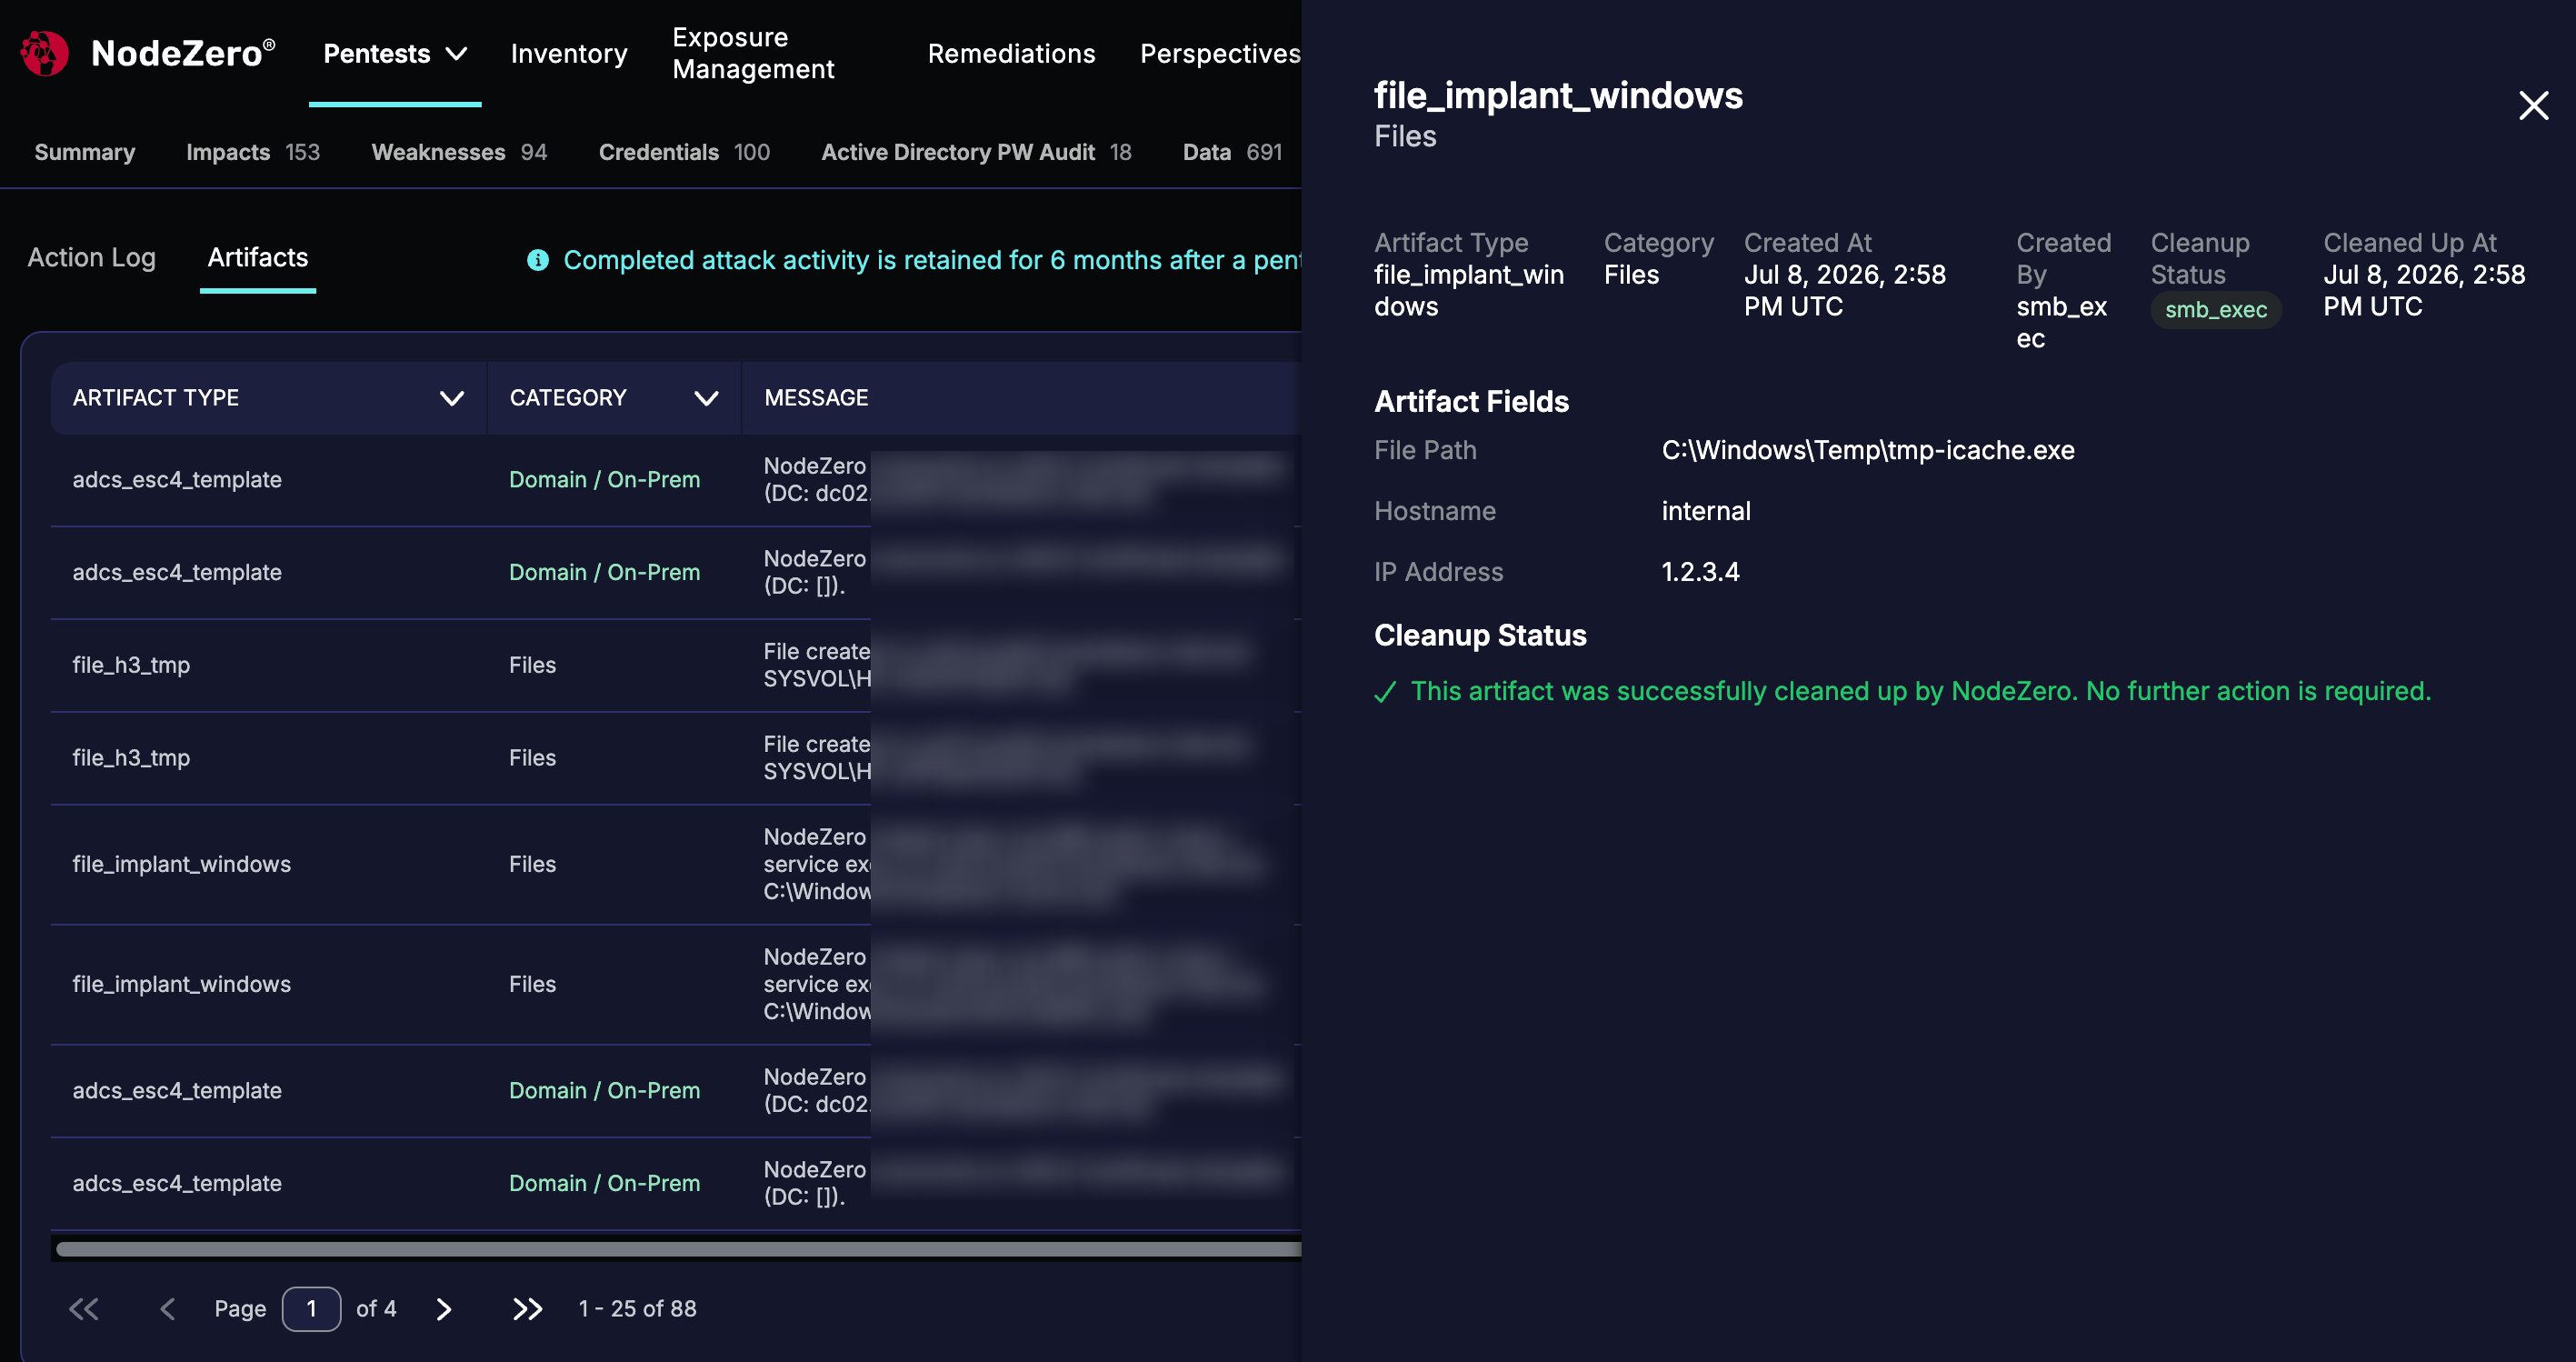
Activity
When you view results for a completed pentest, you can use an Activity link at the upper right to inspect what actions NodeZero took during the assessment, including any changes it made to your environment.
You can use these dashboards to correlate NodeZero test events against your SIEM or SOAR to distinguish and deconflict NodeZero's benign testing from malicious attacks, and to view any test artifacts (such as files that NodeZero created).
Where's my page?
Within test results, the Activity link might initially be on a More drop-down at the upper right. On the resulting page – as in the Real-Time View – tests that do not create artifacts (like Network Segmentation, External Asset Discovery, and WebApp) will display an Action Log tab, but will omit the Artifacts tab described below.
Action Log
This first tab at left, Action Log, provides a post-op view of the pentest's events over time. For details on filtering and enriching the display here, see the corresponding Real-Time View topic. (The RTV's Inject Credentials button is omitted from this view of a completed test.)
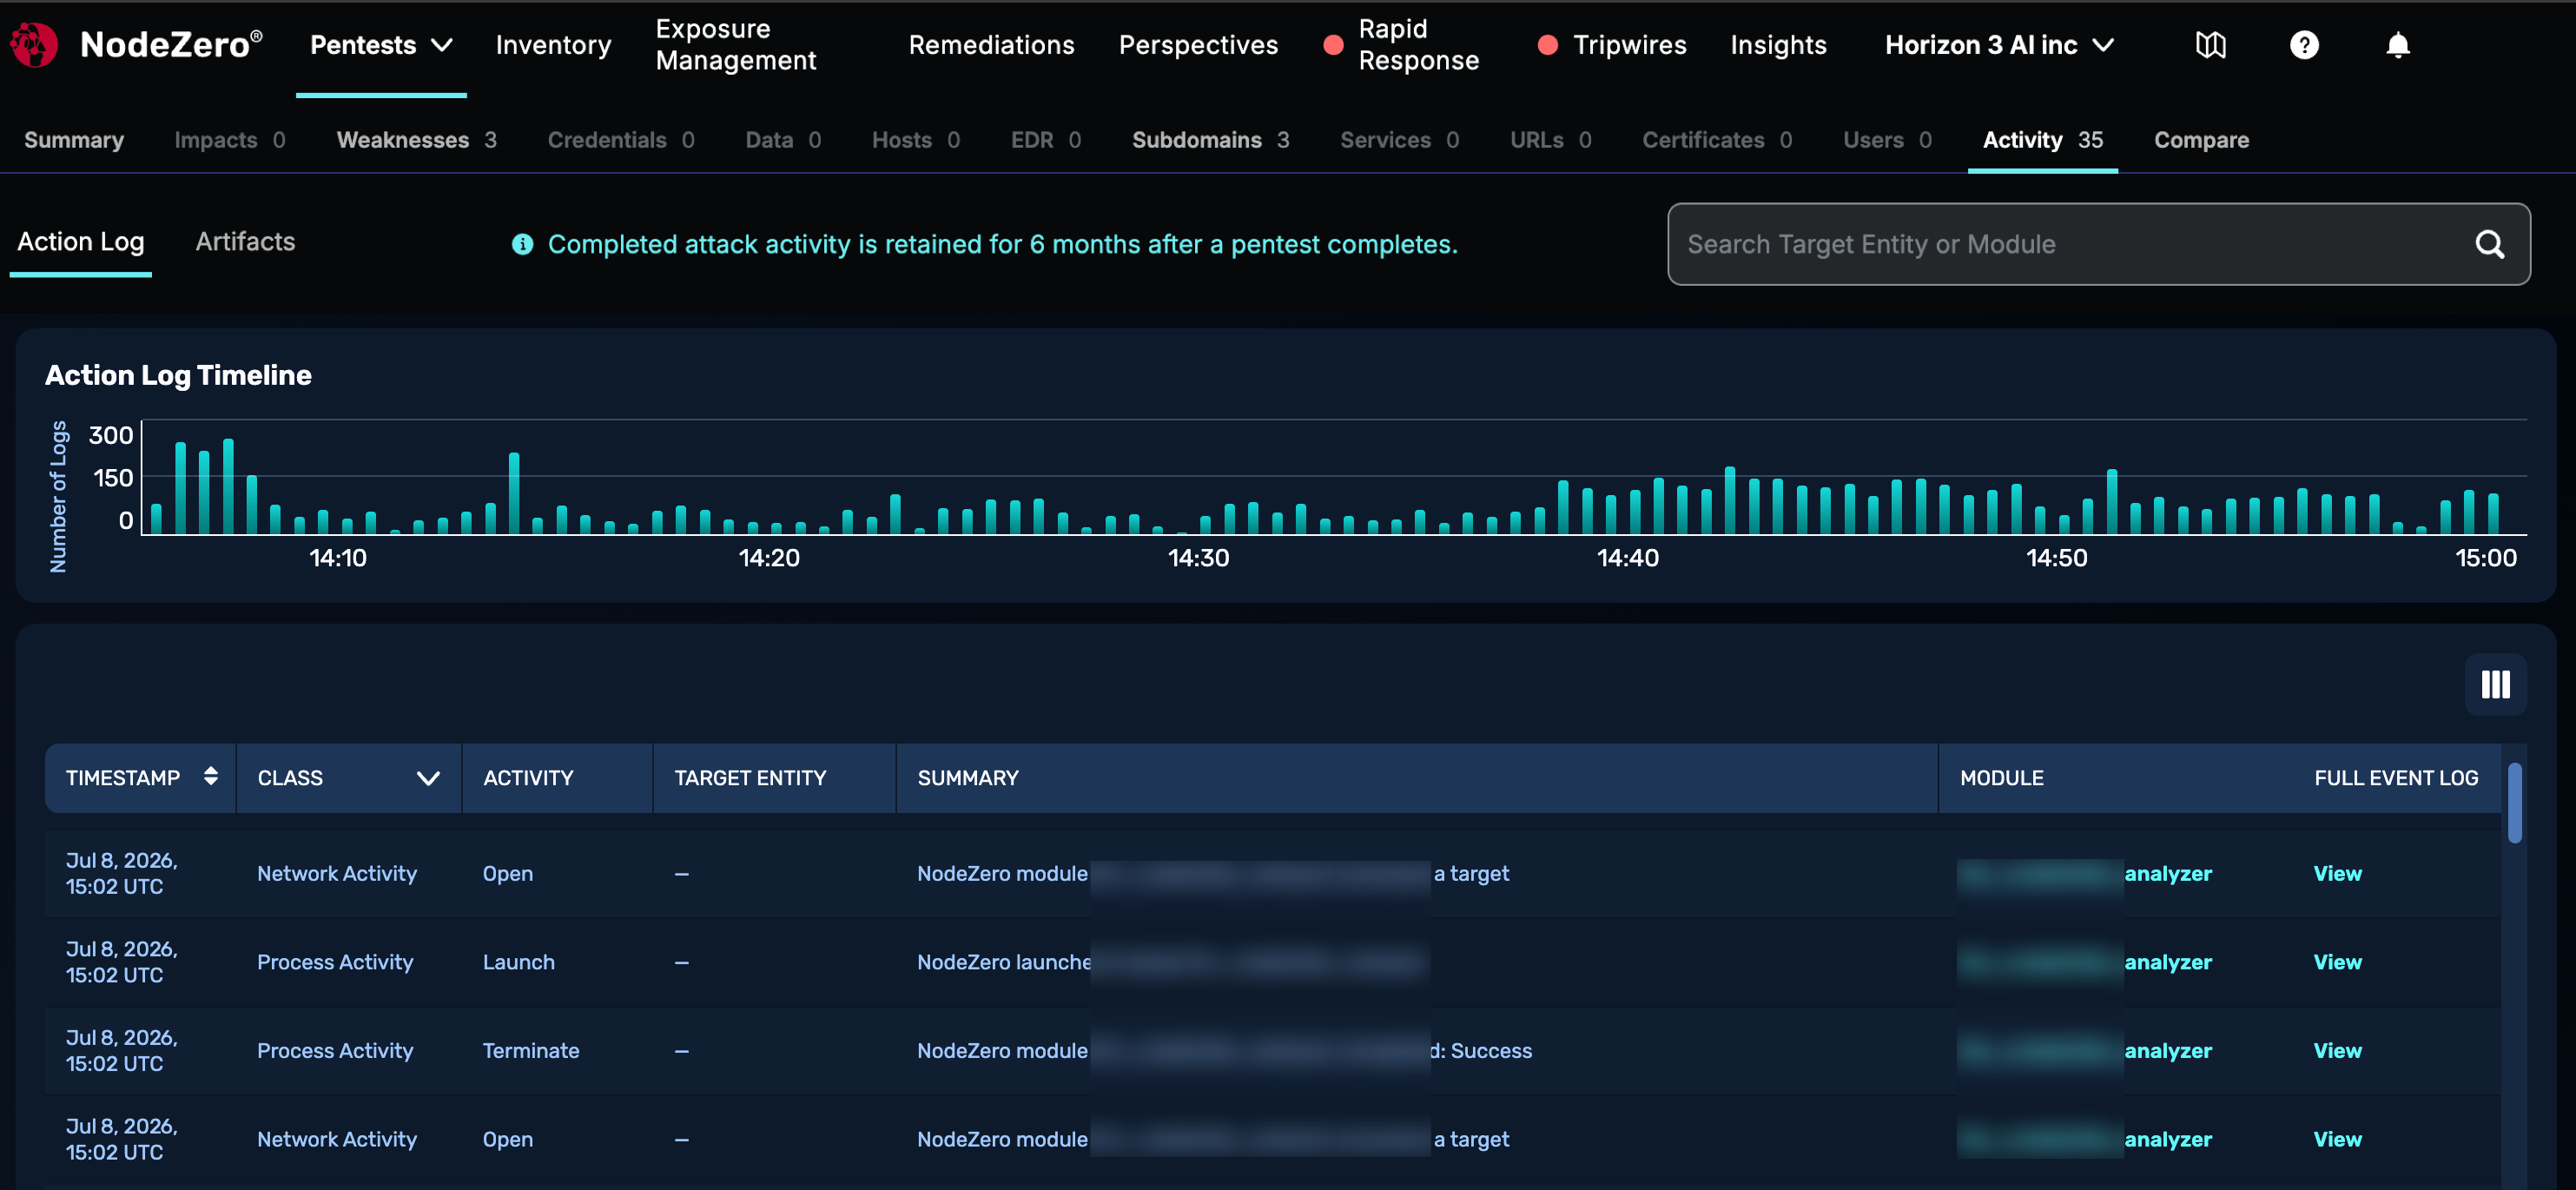
Artifacts
On pentests that attempted to actively modify your infrastructure, you'll see a second Artifacts tab. This tab shows you any changes NodeZero that made to your environment as part of the test. It provides the information you need to determine what was changed, and whether or not the change was automatically cleaned up.
Some changes are not automatically cleaned up, for various reasons – such as when the target environment's EDR (Endpoint Detection and Response) agent prevents NodeZero from deleting a file that it had previously created. This view gives you the ability to determine what was left behind, should you want to perform manual cleanup.
Each entry color-codes the artifact's cleanup status, and you can open a drawer that displays further details. Examples of the entries you might find on this tab are Active Directory accounts, Azure/Entra ID objects, DNS records, password changes, and certificate template modifications.
Navigating Artifacts
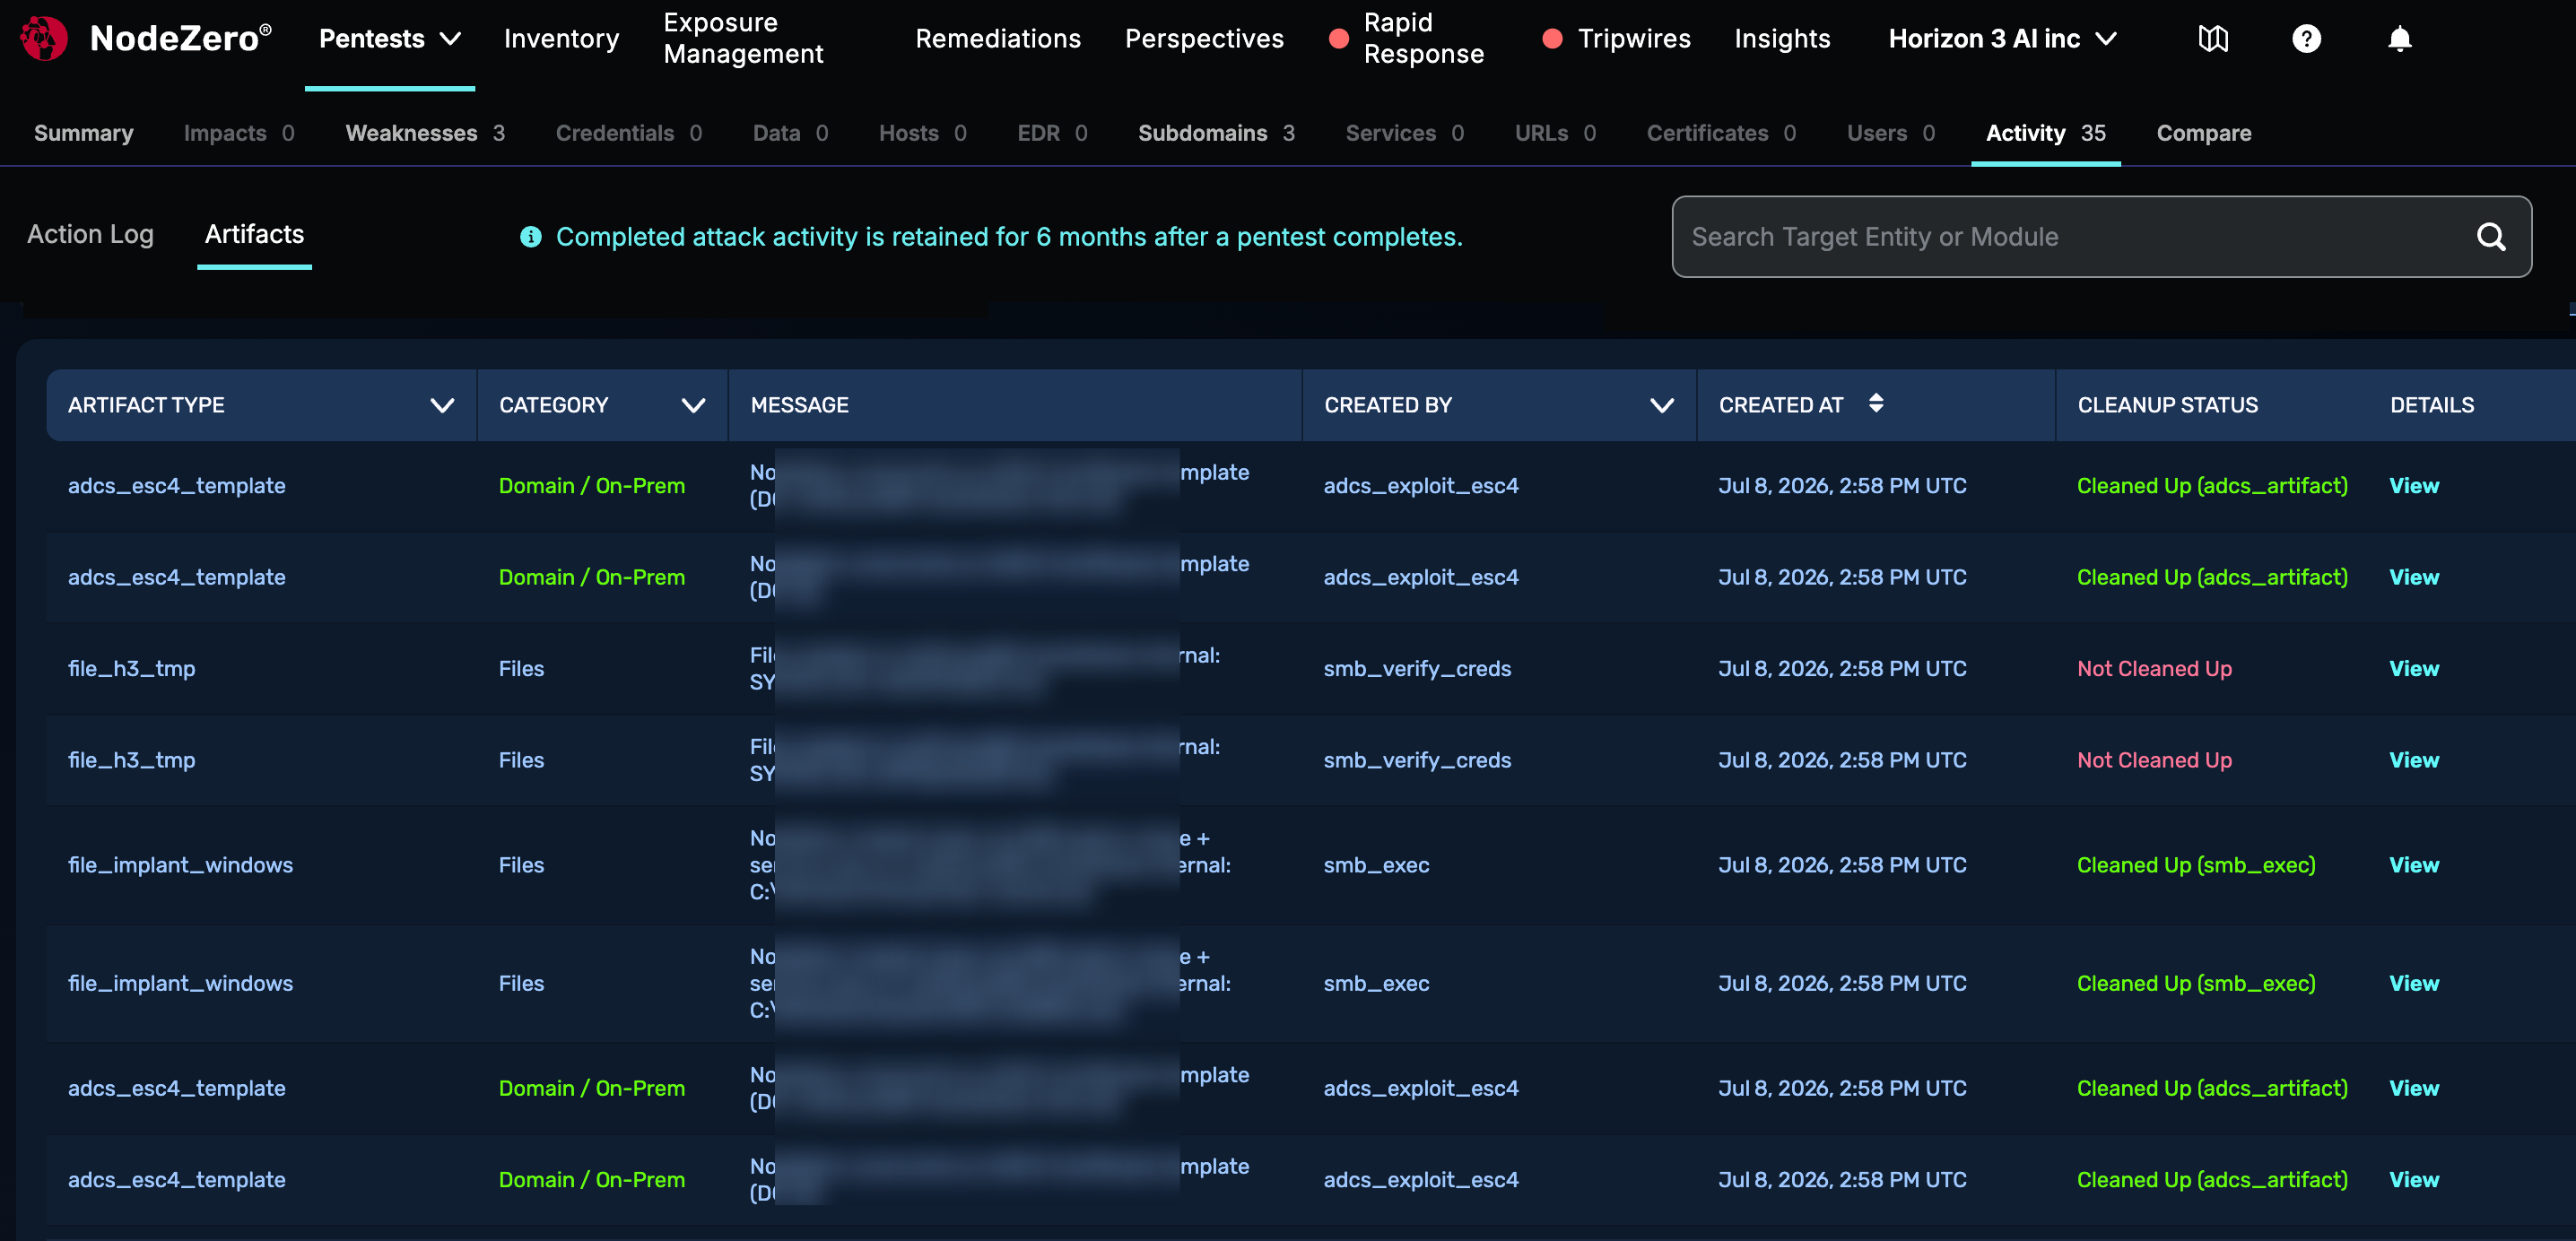
Within the Artifacts table, you can can filter the Artifact Type, Category, and Created By columns by clicking on their headers. The Message column displays additional details about each artifact change. The upper search bar enables free-text searching across any of these fields.
The table's default sort order is by descending Created At timestamp. You can reverse the order by clicking that column header.
Cleanup Status and Details
As shown above, each entry will display one of two Cleanup Status indicators:
-
Green for artifacts already Cleaned Up by NodeZero, with a short version of the artifact's name.
-
Red for Not Cleaned Up artifacts, which might still be present in your environment, and which therefore merit further attention.
In the adjacent Details column, click View to open a drawer that displays specifics like the item's file path, hostname, and IP address. Not Cleaned Up drawers include remediation guidance:
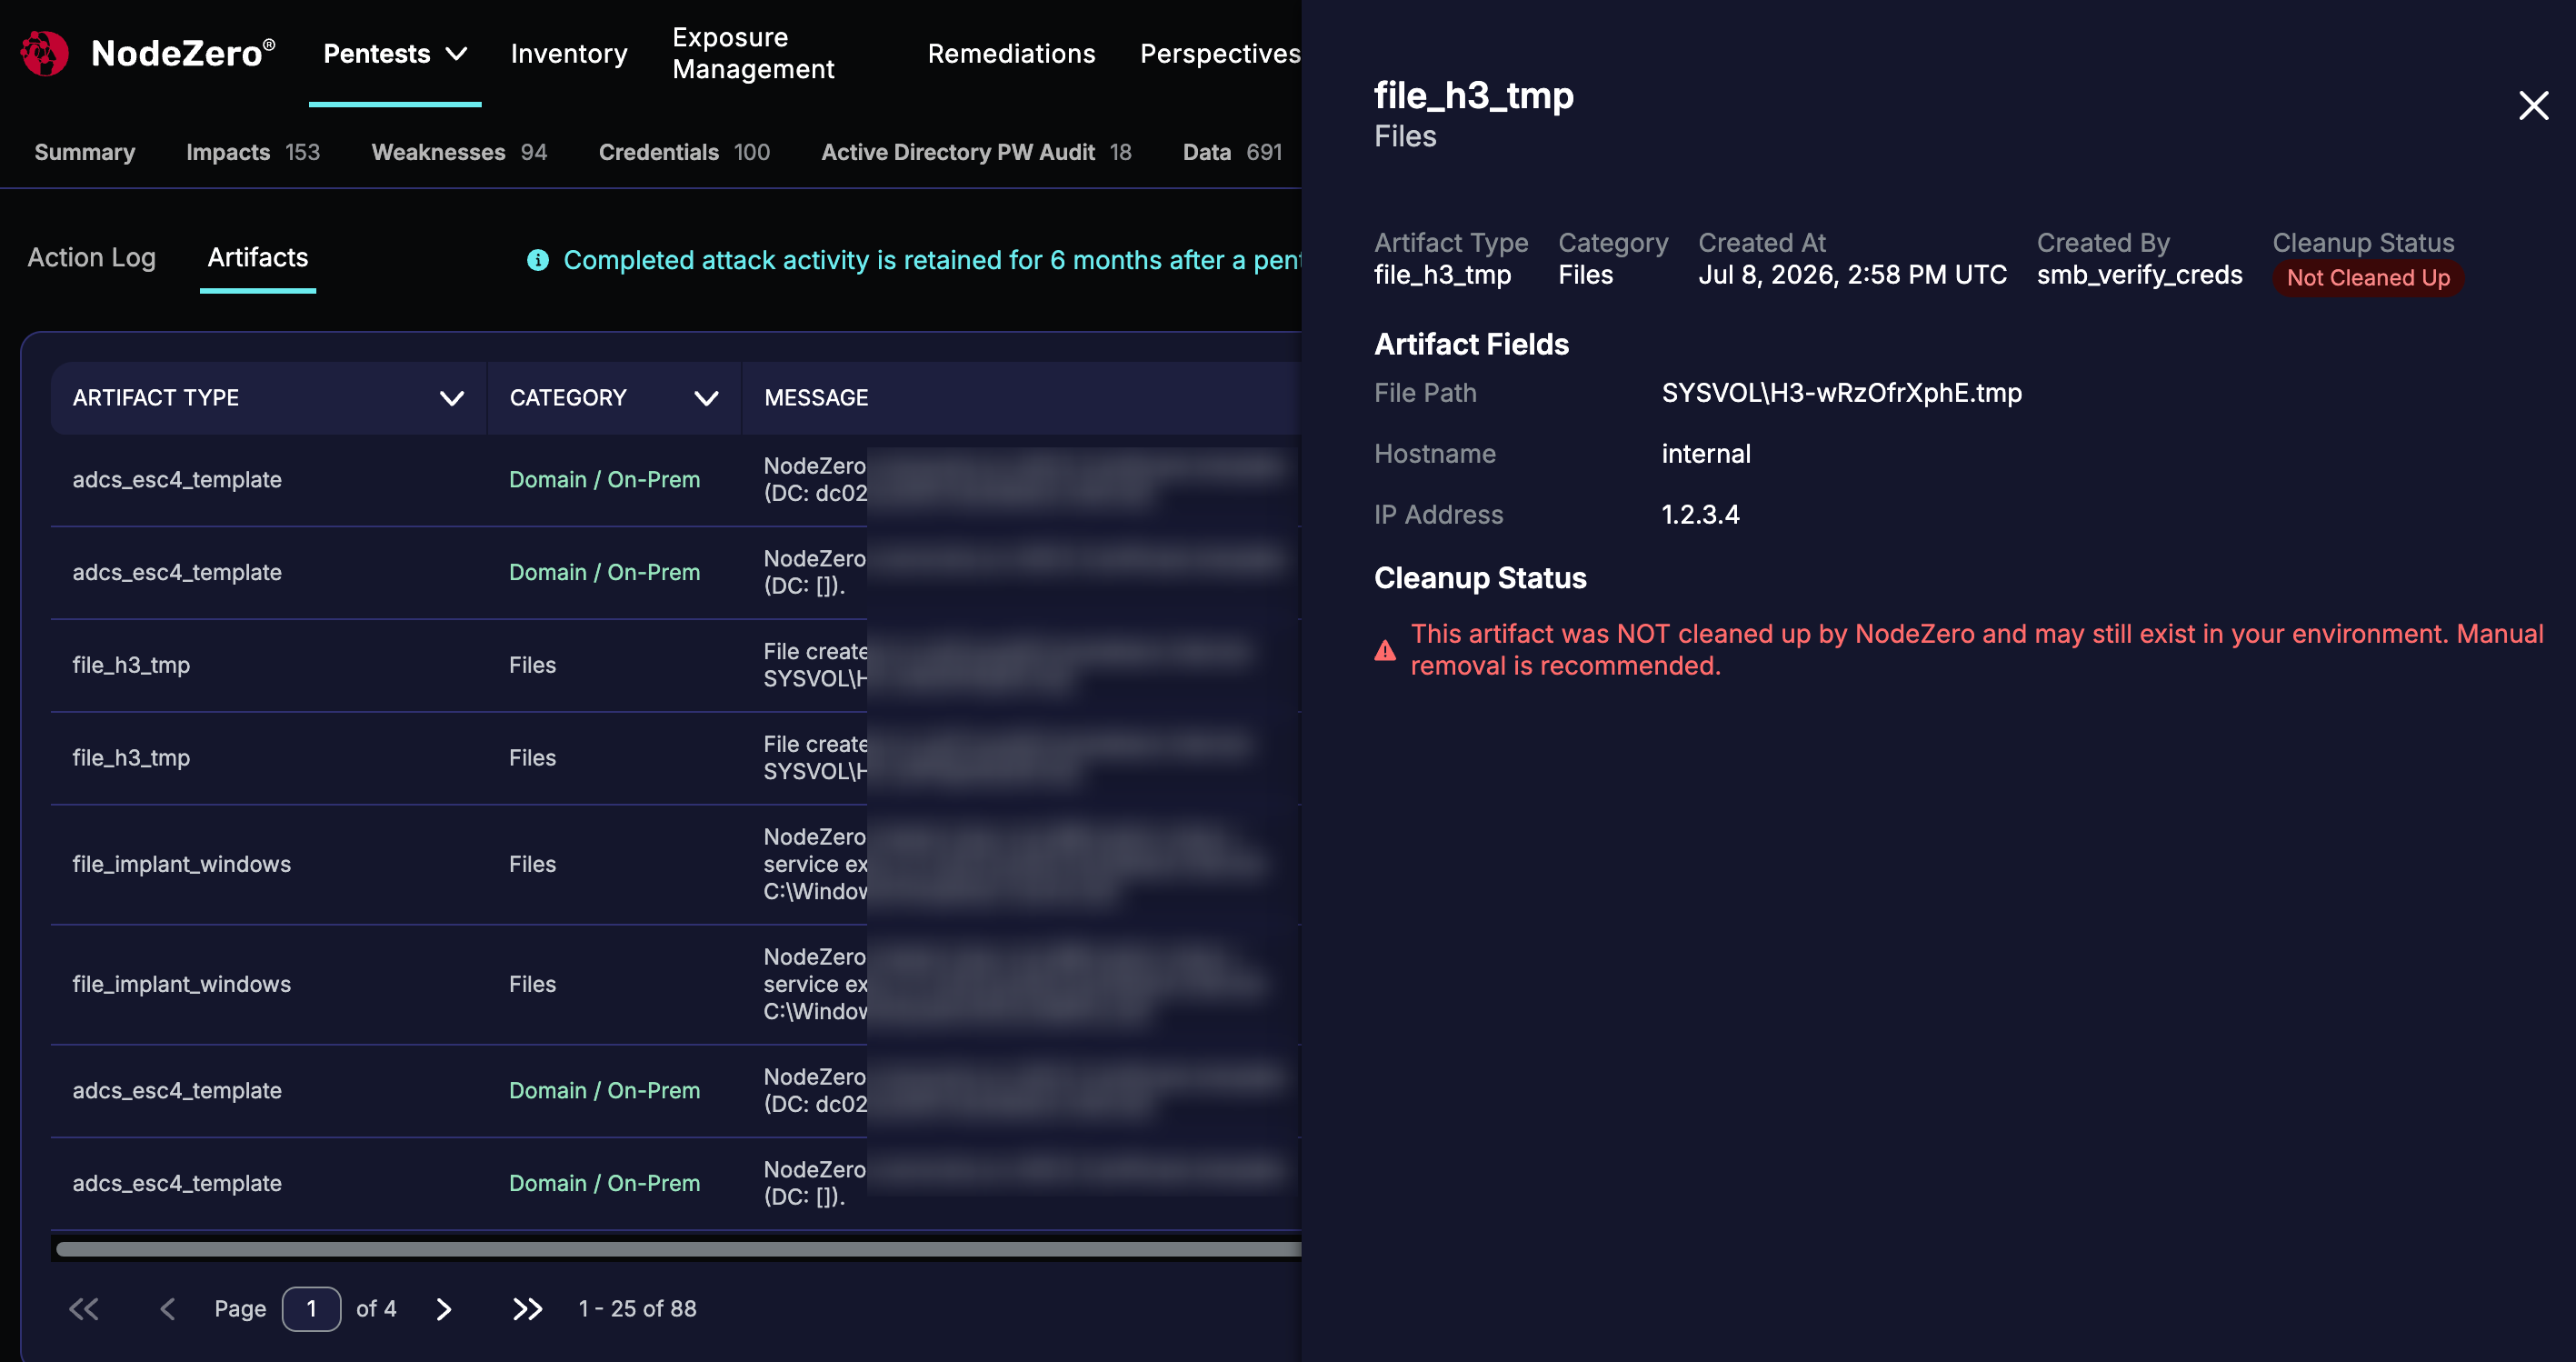
Cleaned Up drawers simply provide confirmation specifics: