Real-Time View (RTV)
NodeZero's Real-Time View provides live monitoring of each pentest's progress and impact – what NodeZero is doing, why it matters, and how each step contributes to risk discovery. Within the NodeZero Portal, RTV provides a dynamic view of events as the test unfolds, in graphical and tabular formats.
These portal views of the event log enable you to correlate NodeZero test events against your SIEM or SOAR, to distinguish and deconflict NodeZero's benign testing from malicious attacks.
Action Log Timeline & Table
In the default view, the Action Log Timeline provides a dynamic view of pentest events over time (UTC).
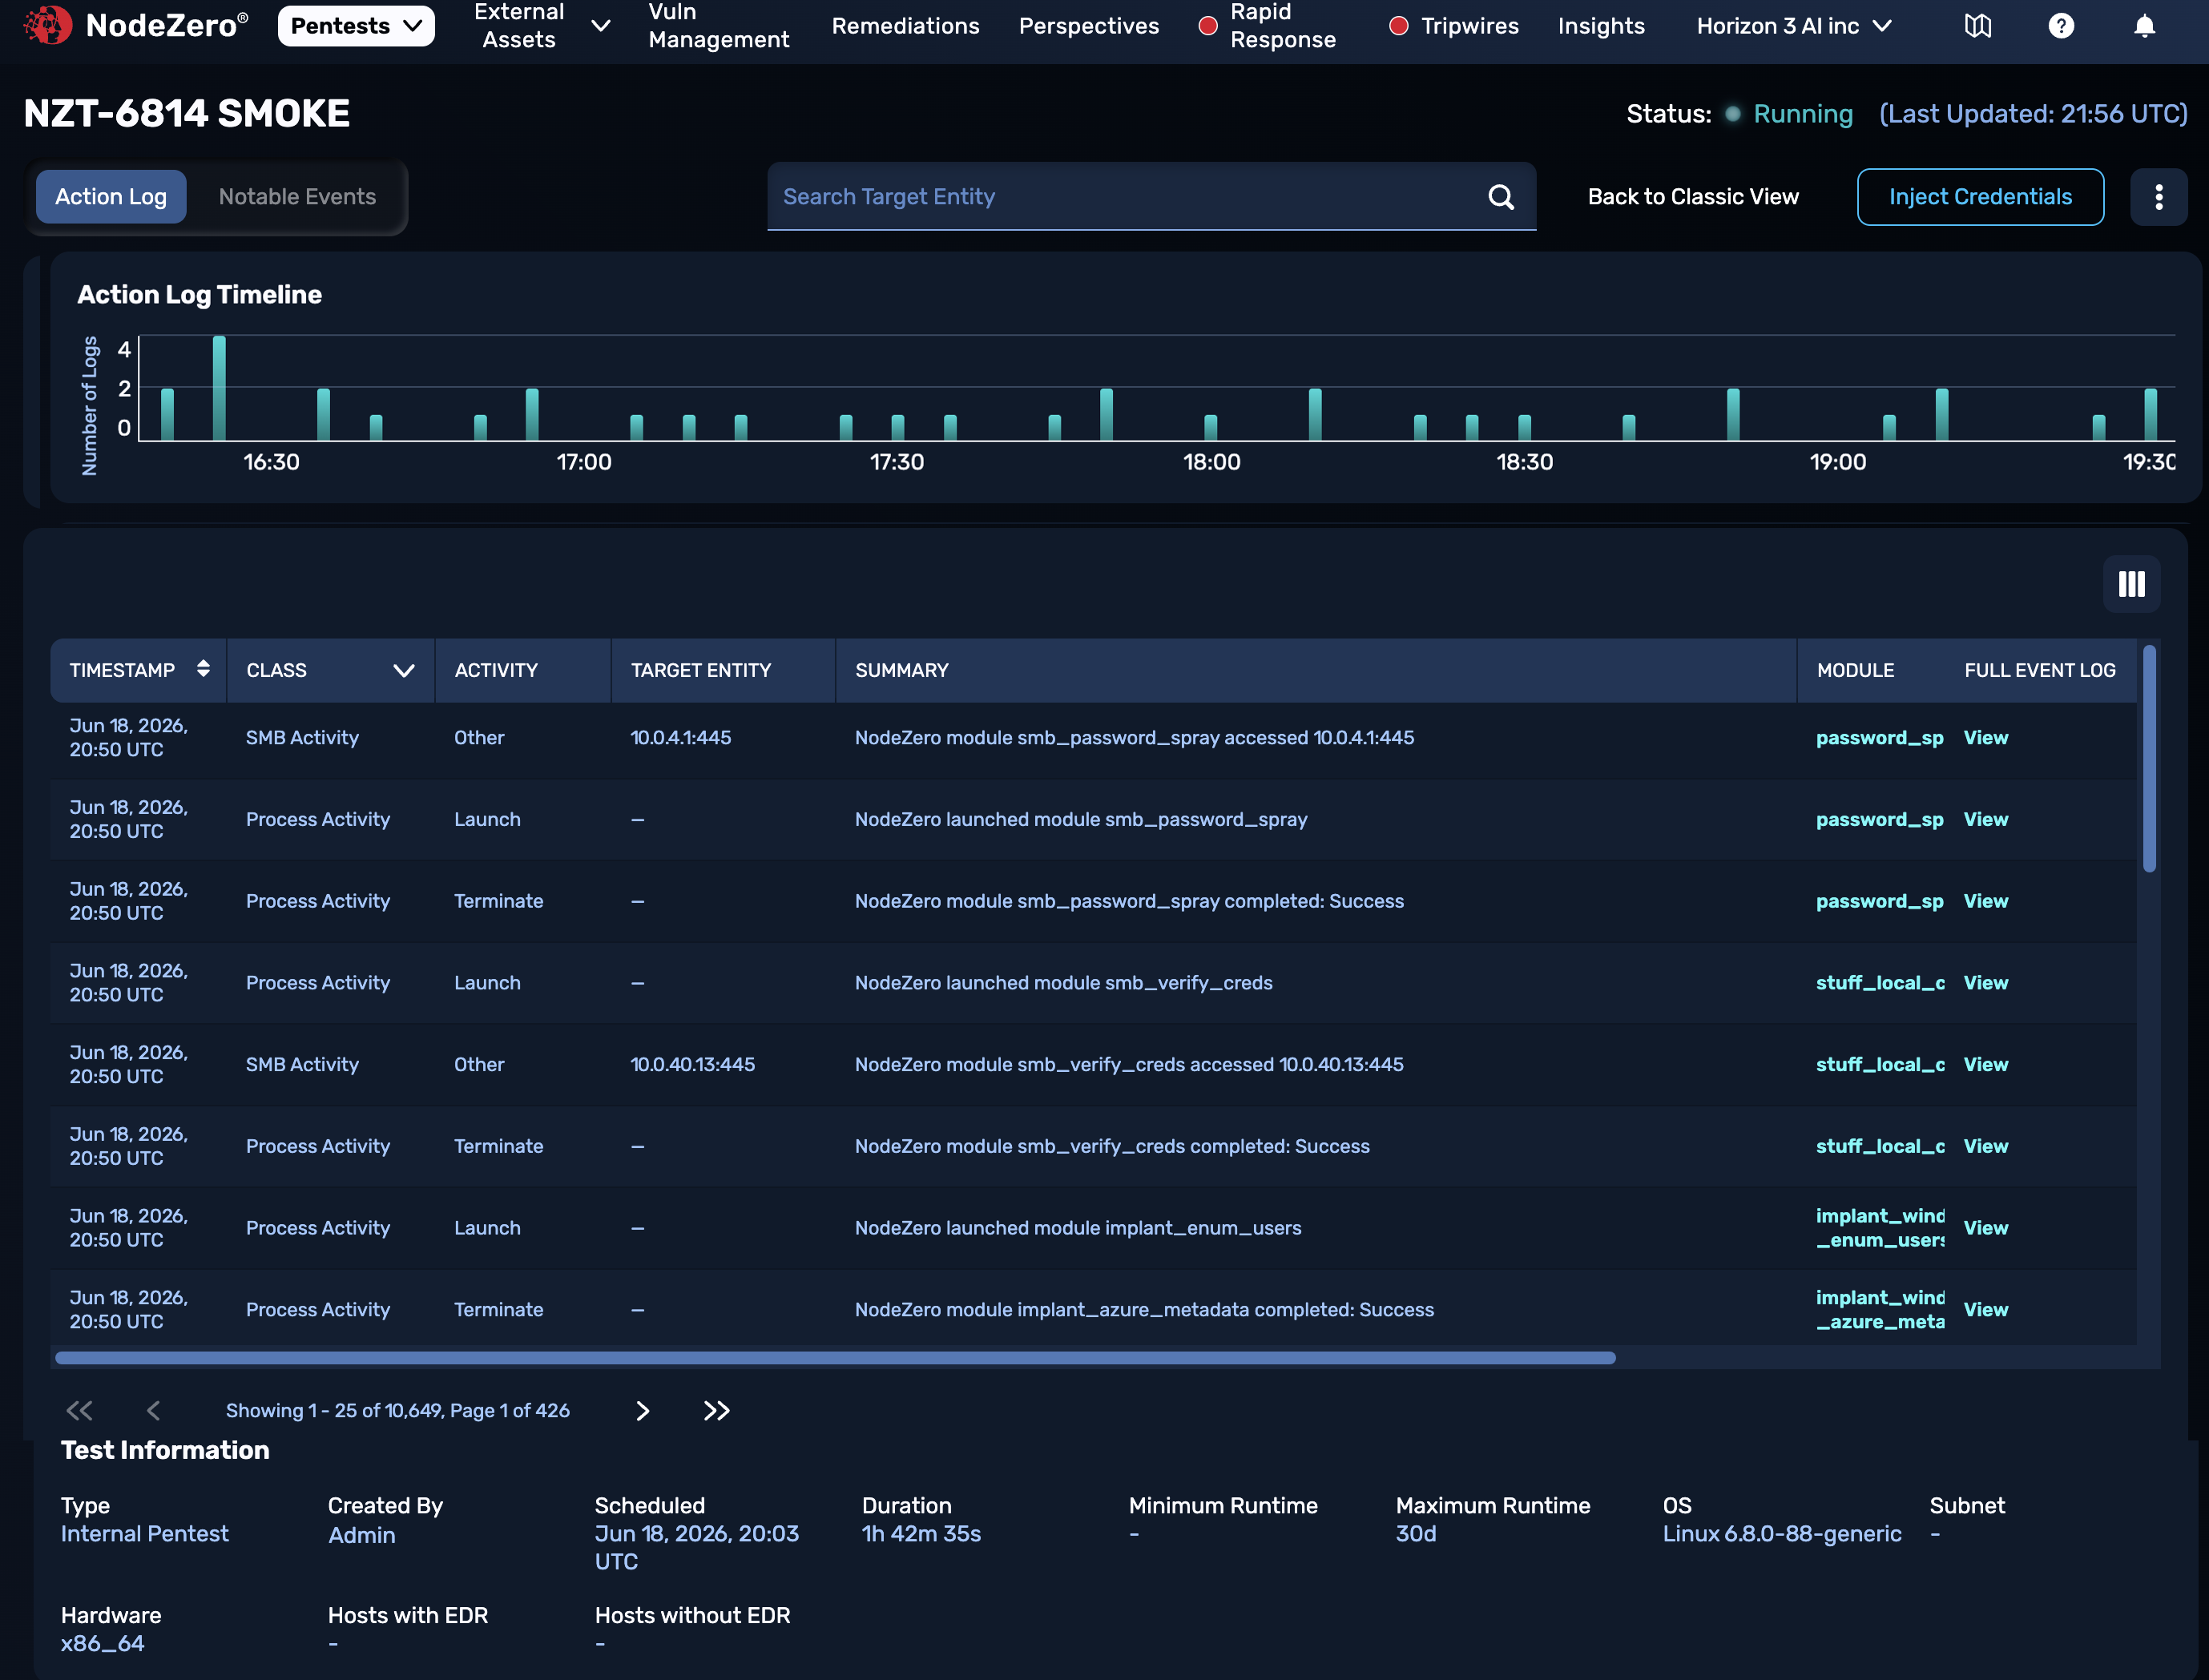
Table Metadata
For each event, the table shows the timestamp, type of activity, module targeted, status, severity, and a summary of the test action. You can sort by timestamp, and you can toggle columns off to simplify the display.
Filtering the Display
The upper search bar provides the option to filter the display by Target Entity. For example, you can paste in an IP address (or IP substring) of interest copied from your security tool, and check whether it matches against a NodeZero test event. Both the timeline and the table will condense to show only matching events.
In the upper timeline, you can click and drag to set time boundaries of interest, and the table will refresh to display only events that occurred within those times. To remove your time restrictions, click the close box below the timeline to restore the full 8-hour display.
In the table's MODULE column, you can click a module of interest to narrow the table's display to only events associated with that instance of the selected module. To restore the display of all events, click the close box above the table.
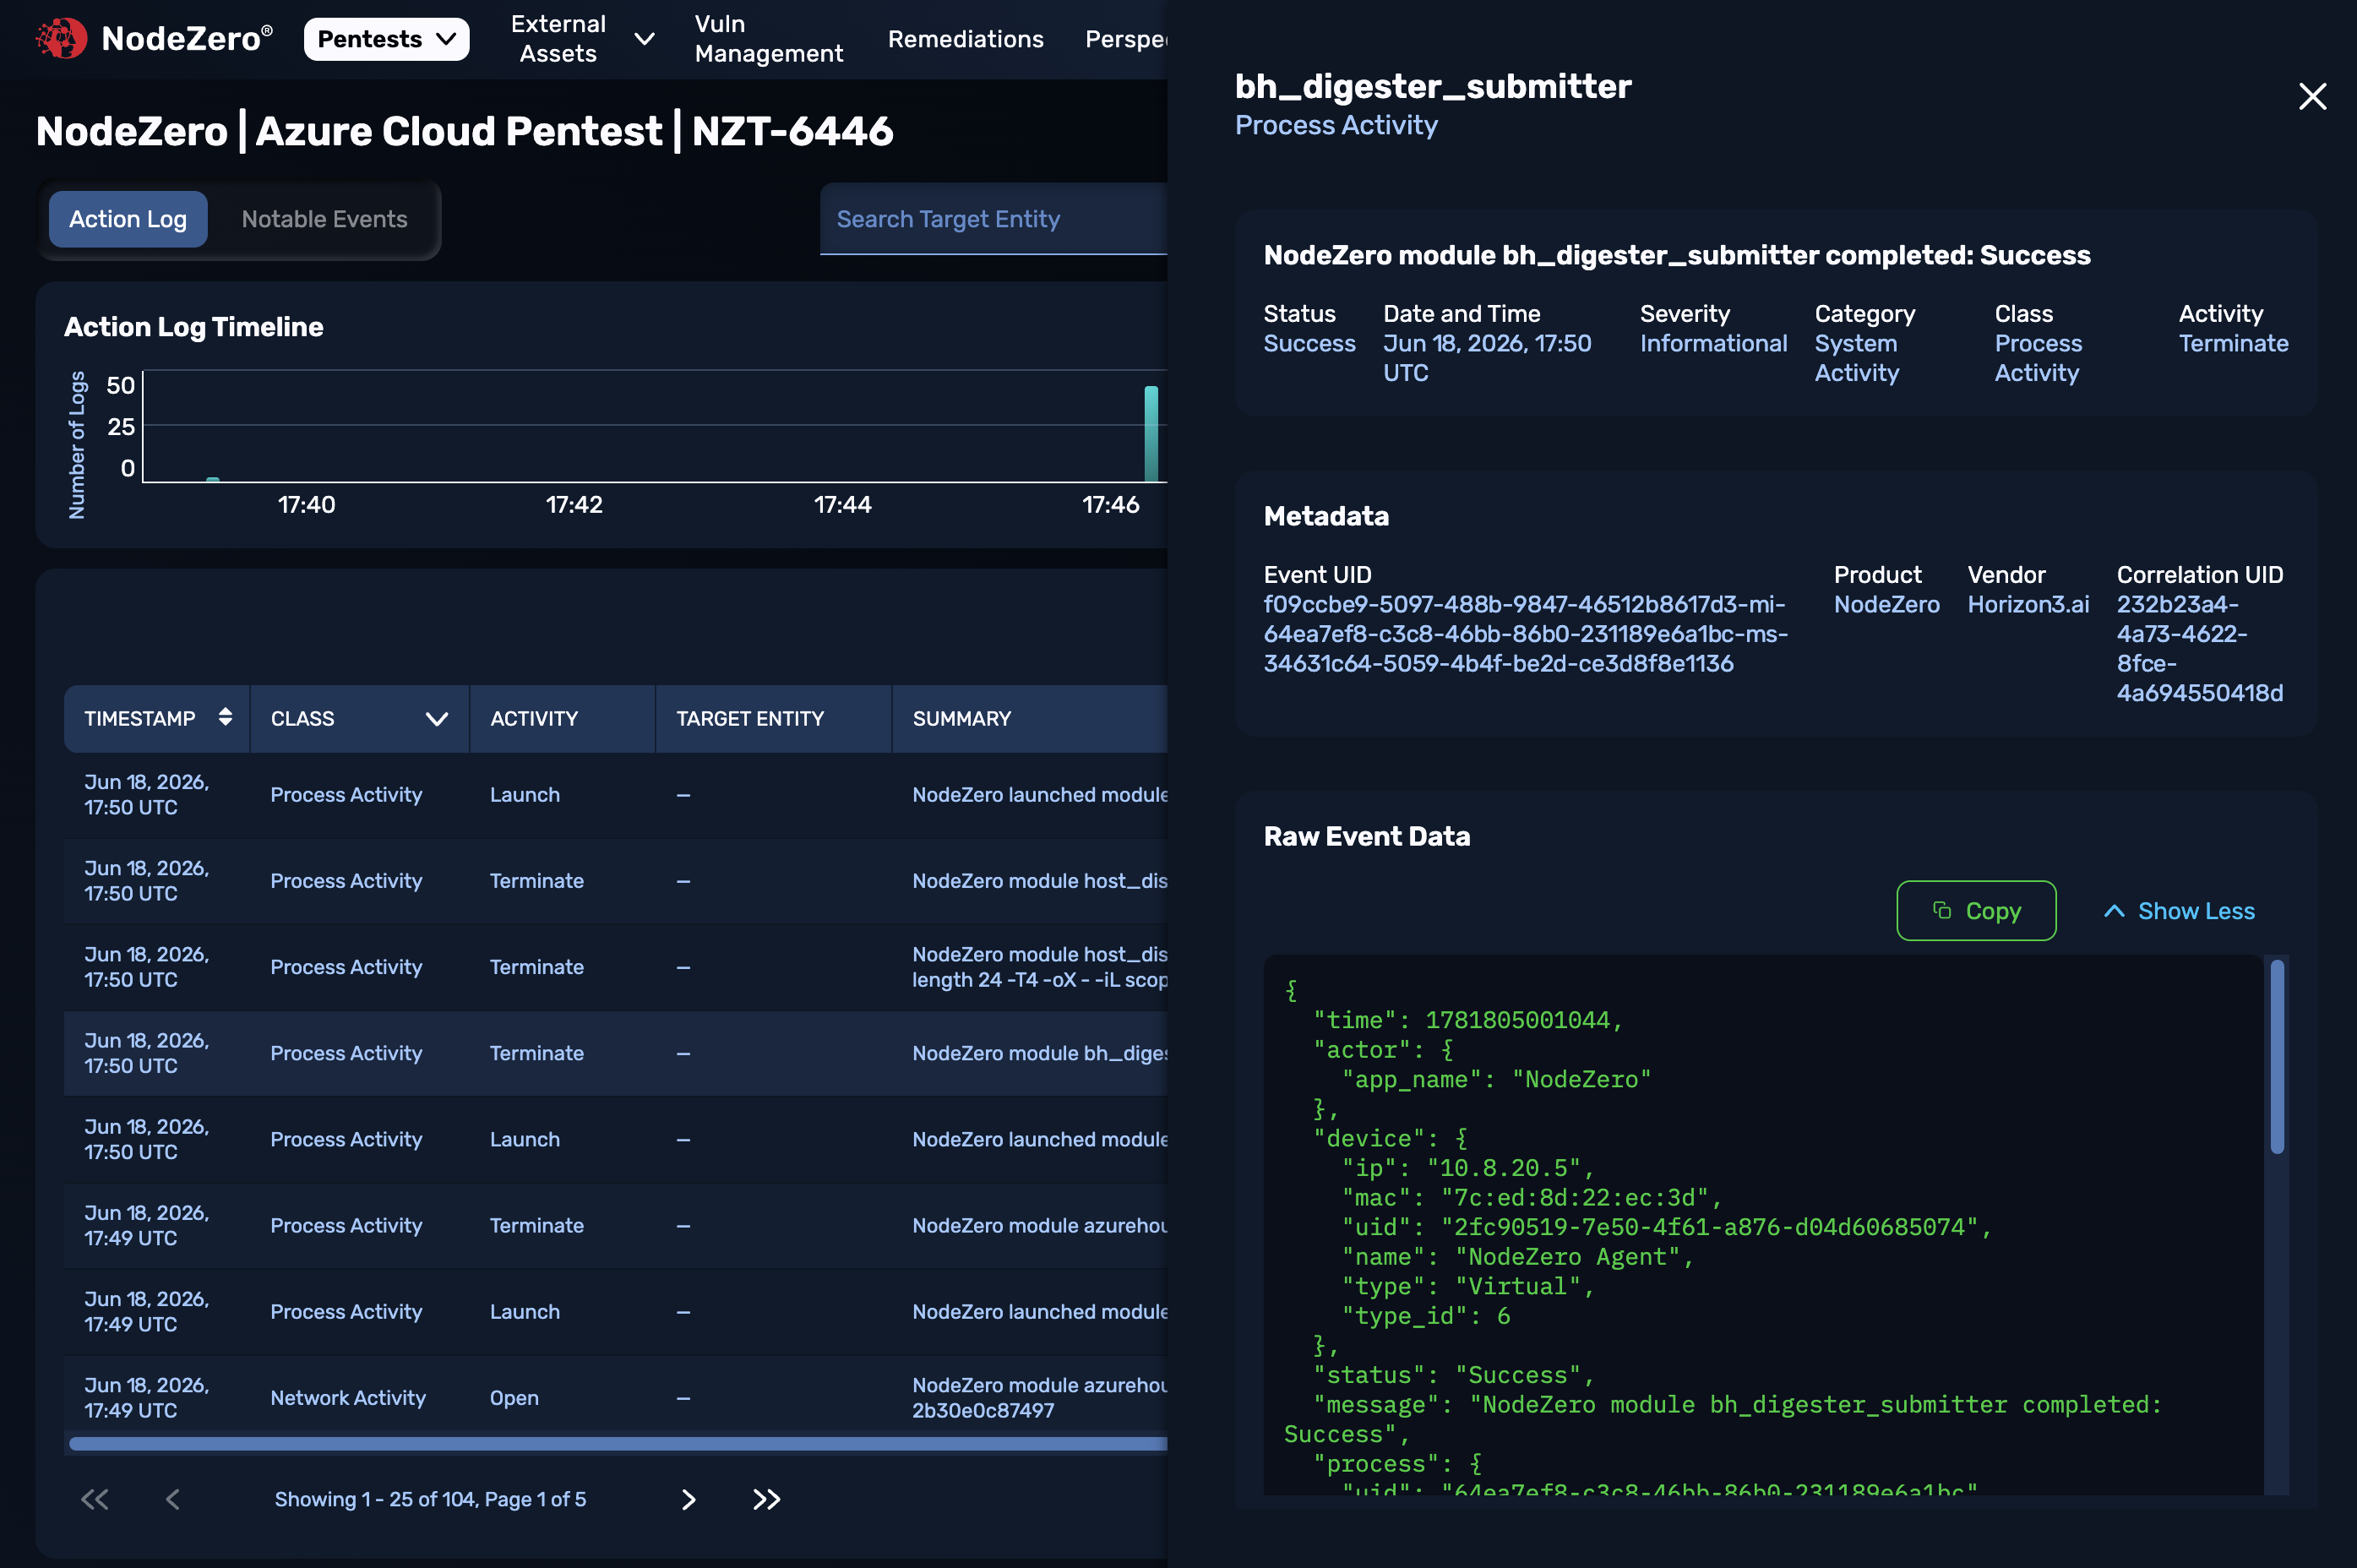
Event Log Details
In the FULL EVENT LOG column, click View beside any event to open a drawer with detailed metadata about that event. Basic information includes the module accessed, product, vendor, timestamp, severity, activity, Event UID, and Correlation UID.
The Raw Event Data panel displays event details in OCSF (Open Cybersecurity Schema Framework) format.
Test Information
Below the table is a concise summary of metadata for the whole pentest.
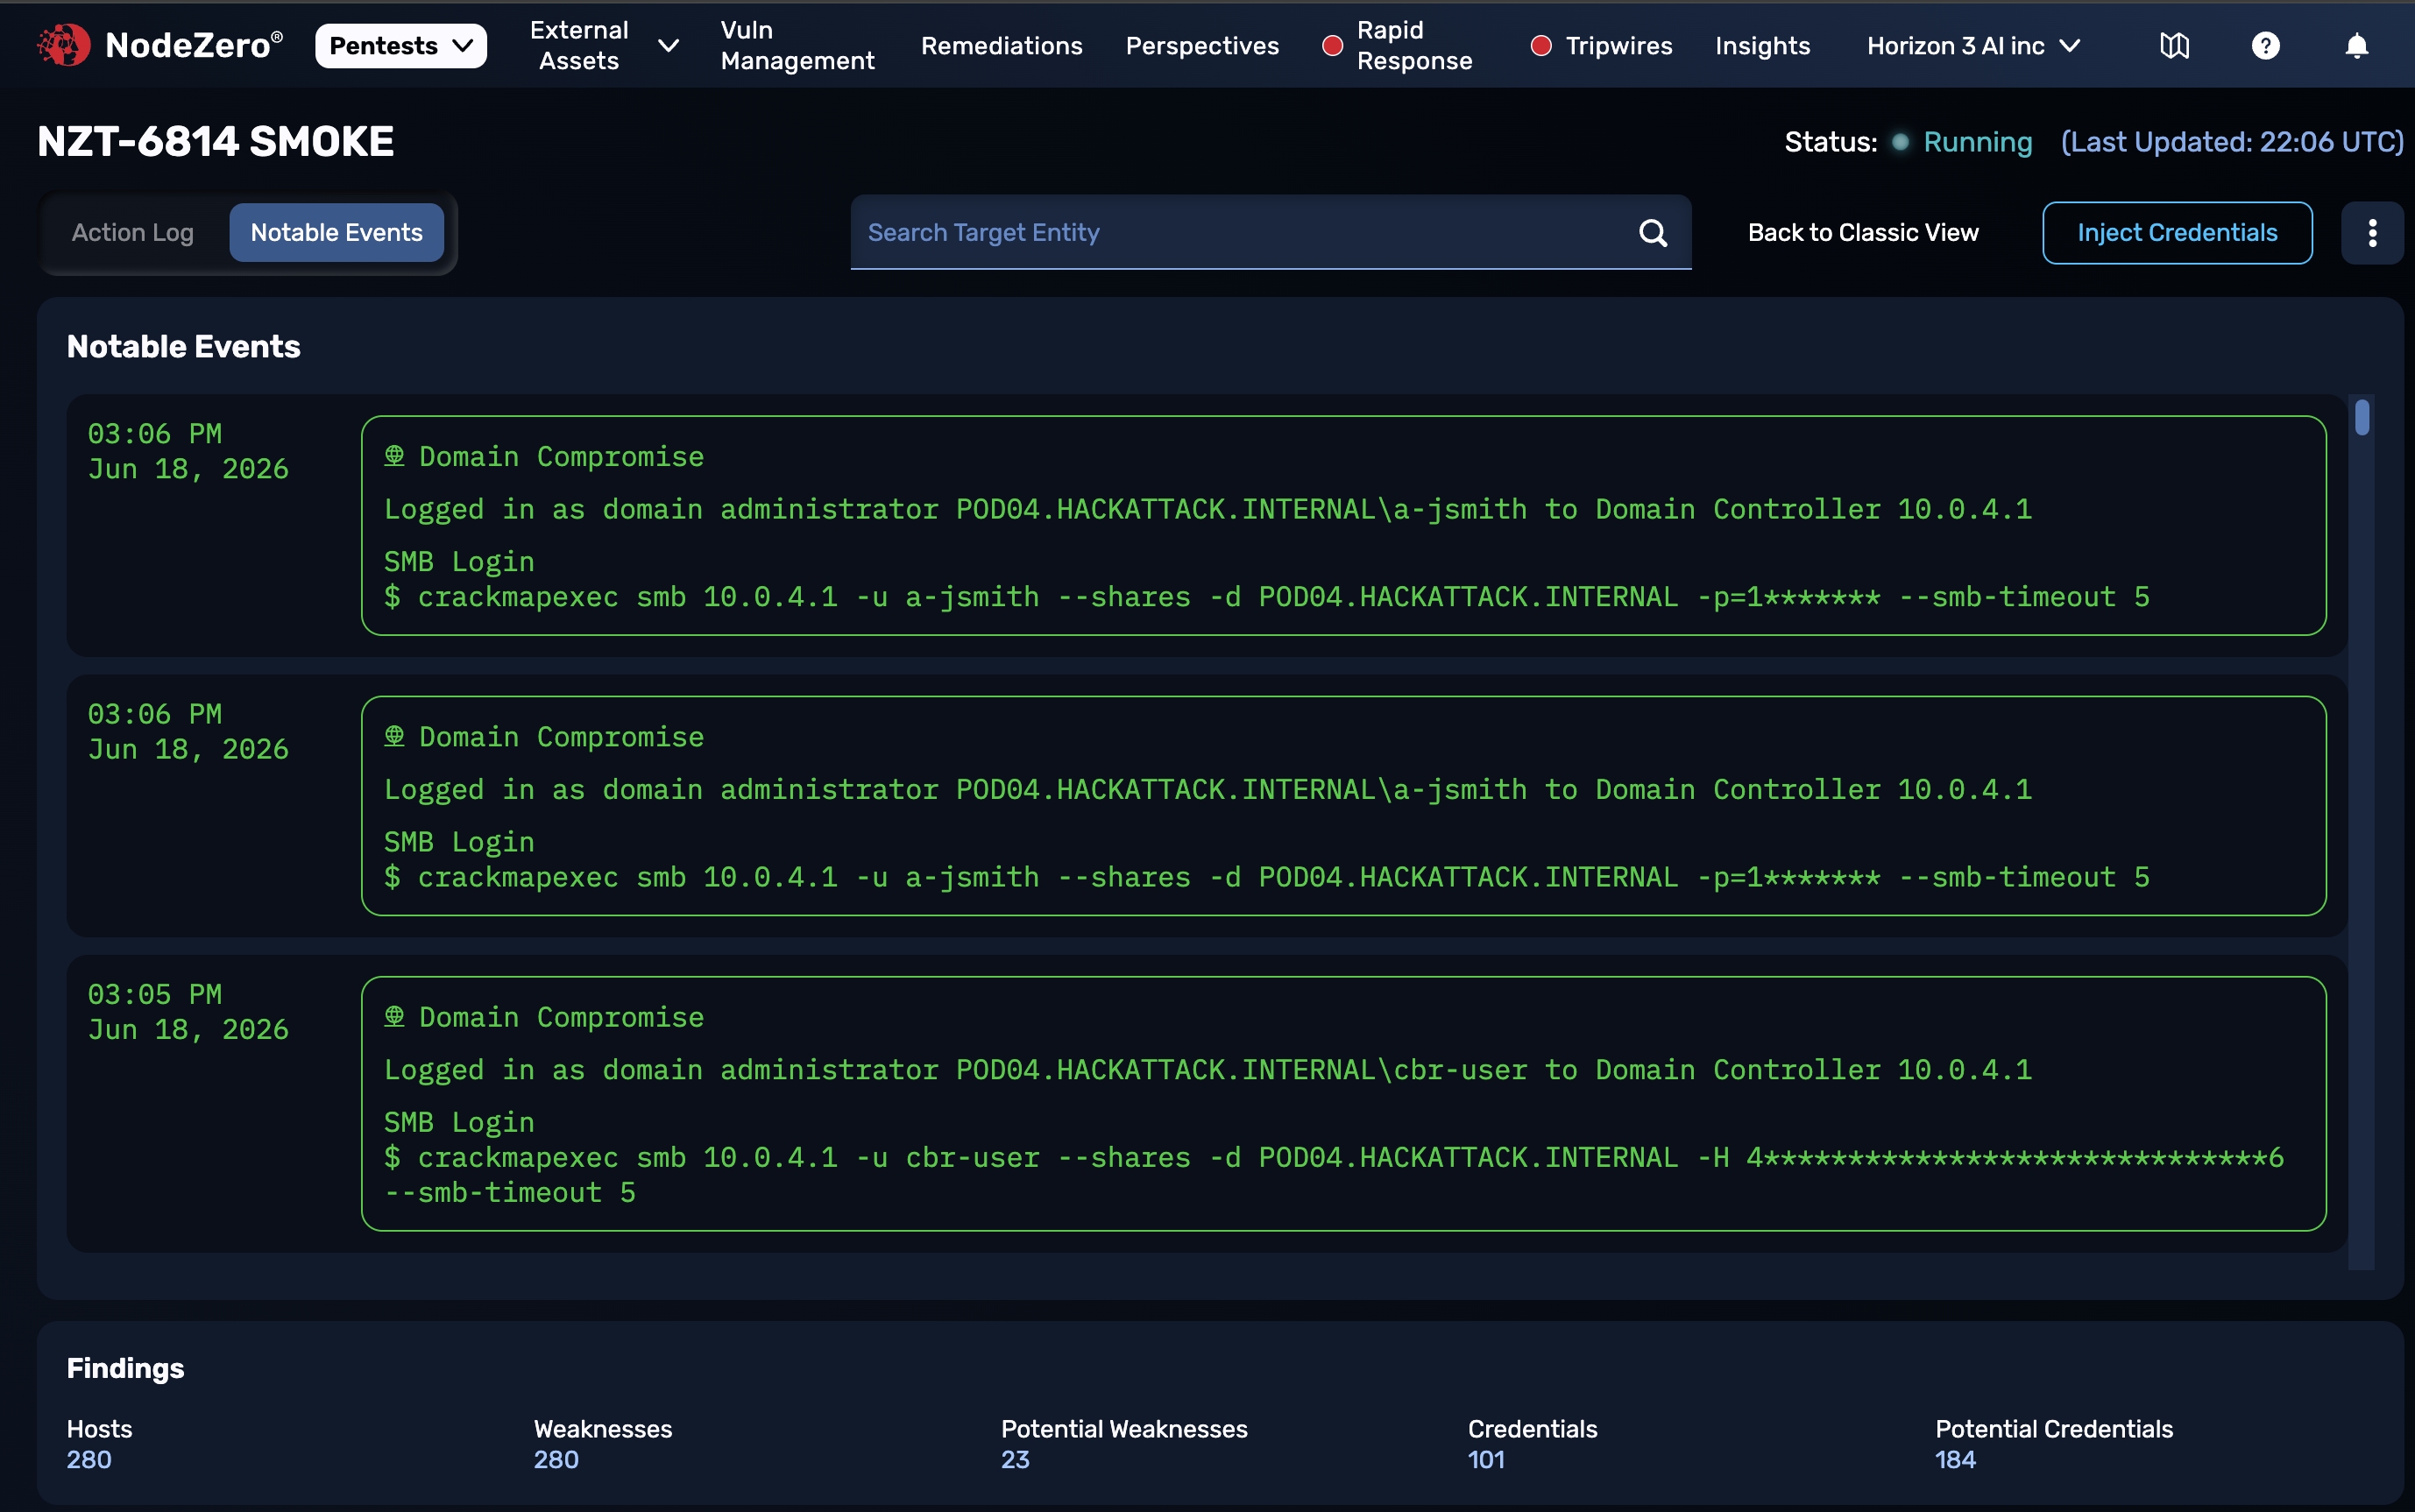
Notable Events
At the upper left, click the Notable Events tab to replace the timeline and raw logs with a focused display of high-impact events from the running test. This "so what?" view isolates key events like credential discovery, host compromise, lateral movement, privilege escalation, and domain compromise.
Here, you can quickly understand what was compromised, to facilitate fast triage, mid-test actionability, and deconfliction. Use these findings to drill into the full Action Log for audit details.
The Findings panel at the bottom of this view displays counts of Hosts, Weaknesses, Potential Weaknesses, Credentials, and Potential Credentials discovered during the test.